The Beyond Pulse Featured Match is designed to give the ECNL community some data-driven and objective insight into the ECNL’s national club competition. In addition to providing performance data on the competition itself, this short post will also open a window into the week of preparation leading up to the national event in Houston for both the St. Louis Scott Gallagher and Oklahoma Energy 2006 ECNL Girls teams.
SLSG vs. OK Energy FC | Sunday, February 19, 2023
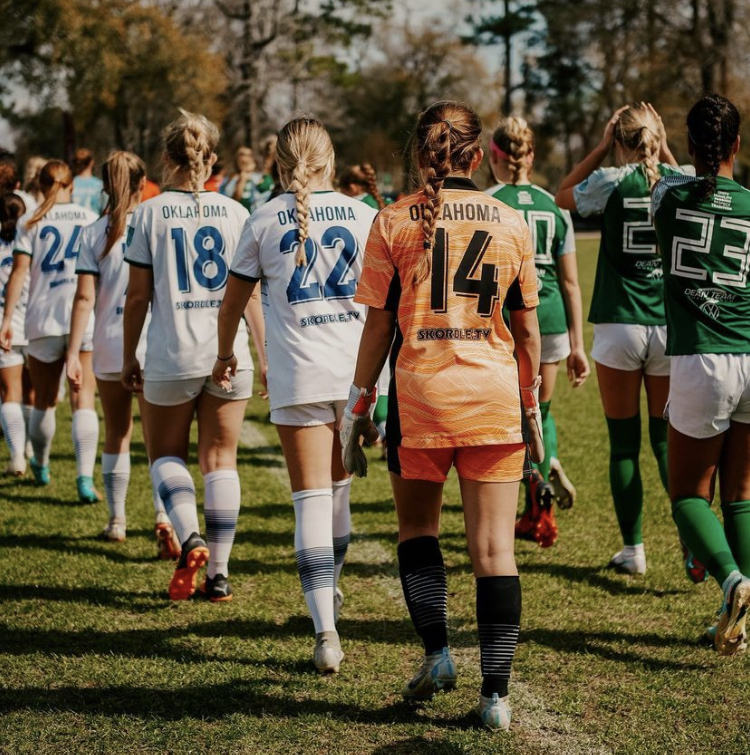
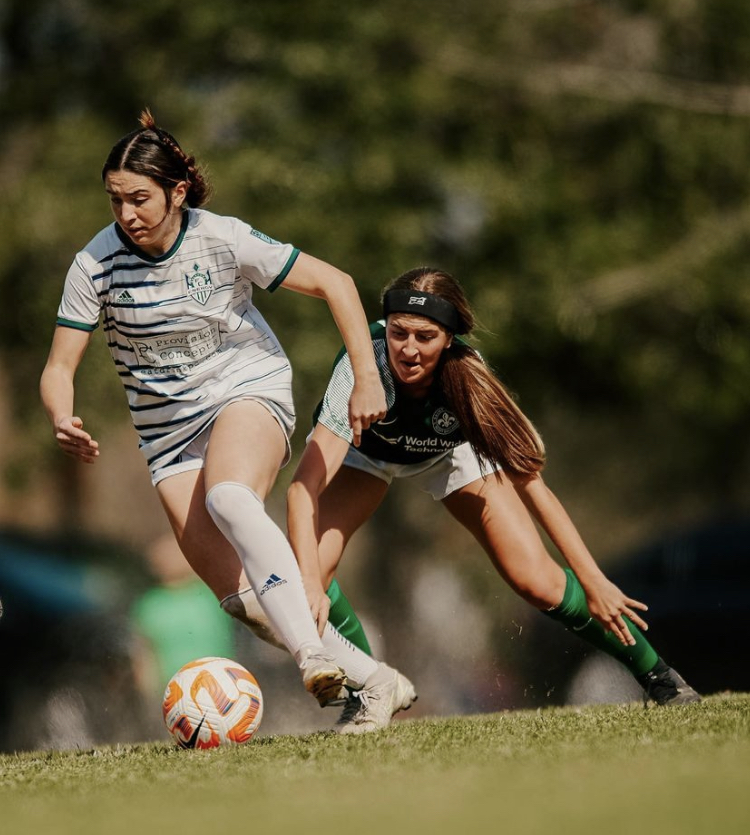
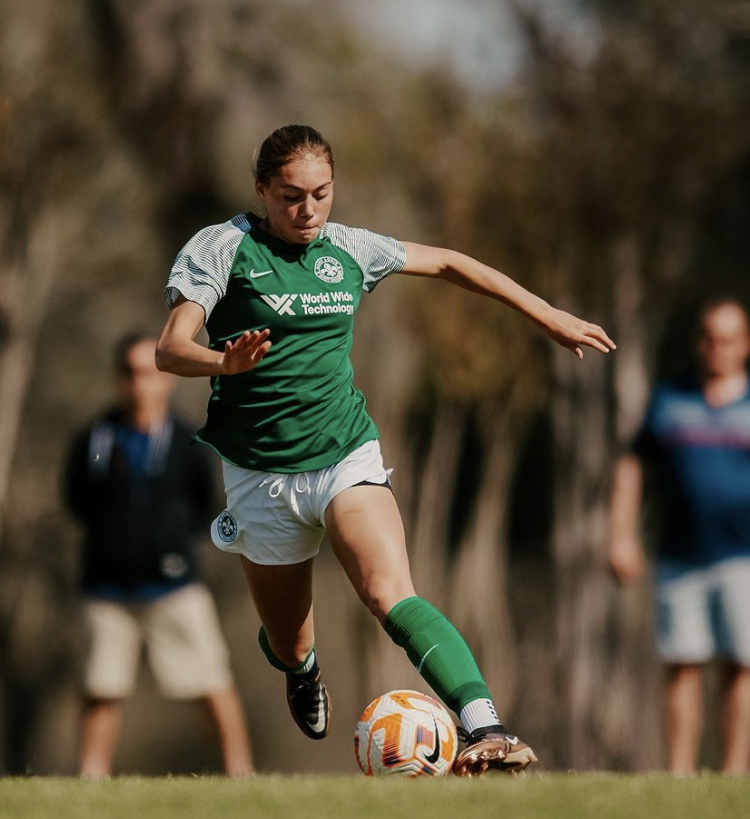
On a bright and sunny day in Houston, two elite girls’ soccer teams, SLSG Navy 06 Girls and OK Energy 06 Girls met at Meyer Park for an exciting match. The SLSG Navy 06 Girls, as the reigning ECNL Girls National Champions, had a perfect record of 14 wins out of 14 games in the Midwest Conference, scoring 65 goals while only conceding 4 so far this season. Meanwhile, the OK Energy 06 Girls, currently placed 4th in the Texas Conference, had an 8-1-6 record with 35 goals scored and 36 goals conceded.
Game Day Insights: Breaking Down the Metrics
A tightly contested affair on the day with the reigning national champions controlling possession for large parts of the game. However, the OK Energy side approached the encounter with a solid game plan to make life difficult for the undefeated SLSG side. After a fast-paced start with both teams signaling early threats, it was SLSG who started to dictate play in possession as they maintained throughout the game. OK Energy defended compactly and showed great desire to remain resilient against the SLSG attacks, while also threatening on the counter and having opportunities to score themselves. In the end, no team was able to break through and score resulting in a 0-0 tie. Now for the data analysis!
QUICK DATA REFERENCE GUIDE
HR > 80%: Time spent working in a high heart rate zone (over 80% of the players’ heart rate maximum). This can also be considered “internal load”.
Average Heart Rate: The average time/speed each players’ heart rate is beating per minute.
Active Participation: The average amount of time the players spend physically active and moving on the field vs. standing still.
Workload: The team’s total workload score. Workload is a measure of volume and intensity. Volume is measured through Distance covered and Intensity is measured by Distance at High Speeds (vs. Low speeds) and the Number of Sprints (including accelerations and decelerations).
Distance Covered: Total Distance covered (in meters) by team average.
Distance at High Speed: Percentage of Distance Covered at “High Speeds” e.g., above 80% of each players’ maximum speed (relative to each player).
Average Speed: Average speed travelled on the field.
Game Day Insights: Interpreting the Data
*Spoiler Alert! What follows is an interpretation of the data that was collected from the above game and the week’s training activities from both teams prior to this event. Like most data, it is open to being interpreted differently. However, we believe this brief synopsis highlights possible factors that could contribute to certain performance outcomes based on trends and theories well documented within the realm of athlete monitoring! Below are THREE prime observations we have made when analyzing both the featured match and the prior training week:
Observation #1
Which is better, who ran the furthest or who ran the fastest?
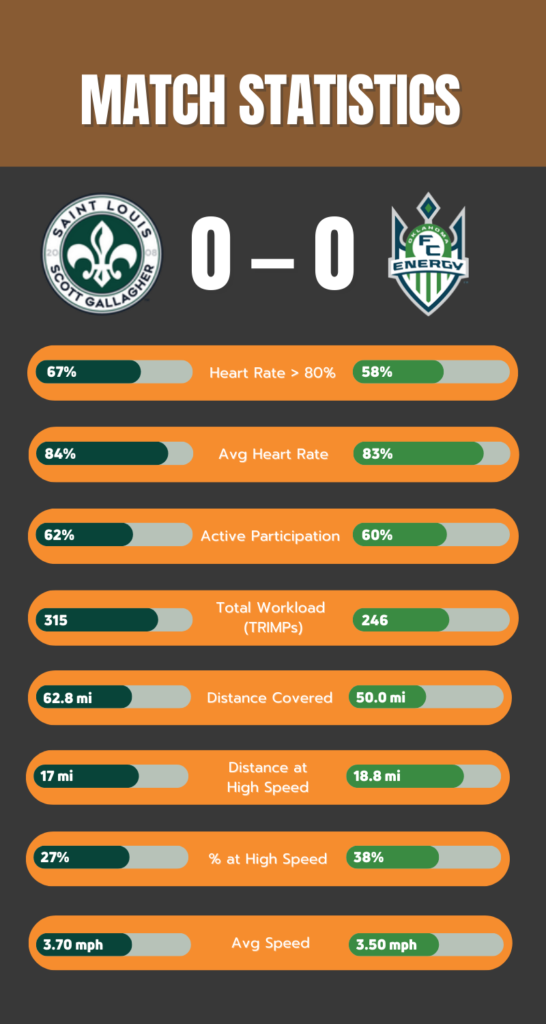
As the above graphic shows, OK Energy covered less total distance and had a lower workload score overall vs. SLSG. However, they did have a greater percentage of distance covered at high speed. In other words, while they ran less, the distance they covered was done at greater speed and intensity.
When comparing with the flow of the game, this could be a reflection of how the team was set up to defend. For example, if they were defending for significant portions of the game, their high-speed running actions could reflect moments when the team was pressing at intensity and speed to try and win the ball back.
It is well understood at the professional level that the defending team will typically run a further distance than the team that dominates possession. However, this is not always the case in youth soccer. Mainly because teams are not as tactically and technically developed (as the pros) and therefore it is highly possible that the team who controls the majority of the possession may also achieve greater distance scores.
The fact that OK Energy ran less distance, but covered their distance covered at greater speed and intensity could also suggest that the team was generally more efficient with their movements. For example, if the team’s plan was to strike their opponent with counter attacks, they could have been more selective in identifying the best possible moments to launch an attack. Therefore, they may have been more conservative with their movements, hence having a lower total distance covered, albeit with greater intensity.
Observation #2
Does higher heart rate reflect harder work, or possible fatigue?
SLSG achieved a higher workload score dominated by the greater distance covered. Simply put, they ran considerably more than their opponents. Usually, this statistic lends itself to positive results on the field e.g., the more you outrun your opponents, the more likely you are to win the game. However, as this result demonstrates, it is not always the case!
The team also spent on average 10% more time working in a higher HR zone (time above 80% of each player’s max) than their opponents. This means their hearts were beating at a faster and higher rate per minute than their opponents. There are two possible reasons for this:
1) A greater HR response (or internal load) could be the result of simply working harder than your opponents on the field. This could certainly be the case for SLSG given how they generally ran further distances than their opponents.
2) Alternatively, increased HR internal load could also be the result of fatigue. Usually, fatigue is accrued from prior events in the weeks prior to the game itself. This is where we will transition to look at each team’s previous week’s activities before this game!
Observation #3
To practice or not to practice, that is the question!
Before explaining this one, let’s take a look at each team’s schedule in the week prior to the ECNL event in Houston.
Week Preparation before competition:
OK Energy
Sunday, 2.12: Game
Monday, 2.13: Light training
Tuesday, 2.14: Off
Wednesday, 2.15: Training
Thursday, 2.16: Off
Friday, 2.17: Travel to Houston
Saturday, 2.18: Game
St. Louis Scott Gallagher
Sunday, 2.12: Game
Monday, 2.13: Training
Tuesday, 2.14: Off
Wednesday, 2.15: Training
Thursday, 2.16: Training
Friday, 2.17: Travel to Houston
Saturday, 2.18: Game
Cumulative Training Load for the Week:
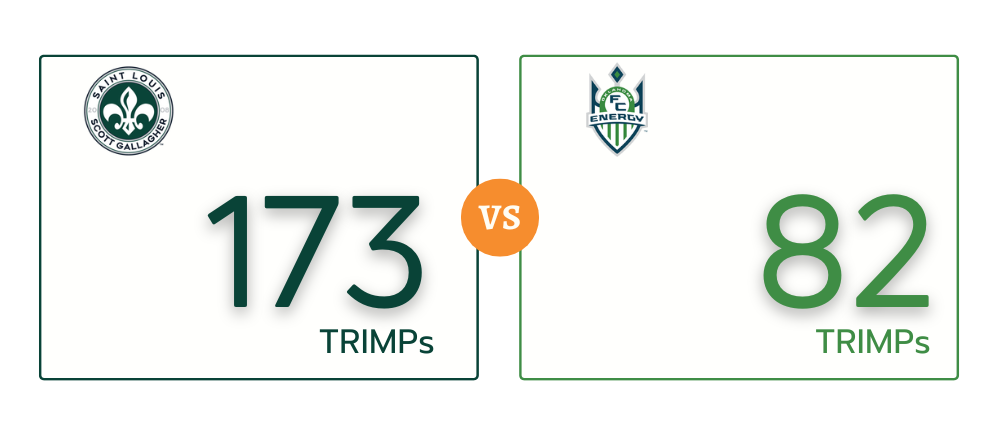
When looking over the data from the week leading into the Houston event, SLSG had a considerably higher workload and schedule. Both teams played games on the previous Sunday followed by a “light” training session on Monday. Both teams also then took Tuesday off before returning to training on Wednesday for a “Moderate” intensity training session.
However, on Thursday OK Energy had the day off and SLSG had another practice session of “Moderate” intensity. Both teams then travelled on Friday and had their opening games in Houston on Day 1 prior to playing each other in this featured game.
While their previous 7-day schedules looked similar, it is important to note the difference an extra day of practice might make. Our data shows that the extra practice on the Thursday was similar to playing an extra game. On its own, this might not be a huge deal, however this is within a 7-day period where the team had already played three full competitive matches (and had a 4th on Day 3 of the ECNL event)! This could be a significant difference when looking at player performance in games and could also be a reason why the SLSG team had a higher heart rate response from the game on Sunday vs their opponents.
Considering Other Factors:
Managing High School Soccer Schedules
It is important to note that both teams were also managing high school soccer schedules AT THE SAME TIME – something that most clubs are familiar with at certain times in the year. In Oklahoma, the high school season is in full swing and is currently about halfway through the season. In Missouri, the high schools are in their pre-season phase with the season officially starting on February 26. Both coaches have tried to monitor this so they can plan their own team’s practices accordingly. Although this is no easy task!
Review
In summary, it is fair to admit that a 0-0 tie is not always the easiest performance to diagnose! However, the purpose of this exercise is not to make any grand conclusions based on a single game-day result. The bigger purpose here is to demonstrate how the use of objective data collected over a period of time can offer unseen insights in to performance outcomes. The application of monitoring data has been used for decades at the professional level of sports and learnings from that environment can also be applied to youth sports to develop best practices in player health, safety and performance! Finally, special mentions to Ralph Richards and Scott McDoniel (SLSG), David Kunitz and Stephen Phillips (OK Energy) for working with us on this experience!
Brought to you by Beyond Pulse and the ECNL.

 FRA
FRA


